Blog · Oxbridge admissions
Oxford and Cambridge acceptance rates by course
Cambridge computer science admitted 7.4% of its applicants in the 2025 cycle. Cambridge maths made offers to more than a quarter of its applicants and admitted fewer than half of them. Each number means something different, and the difference decides how to prepare.
Families usually ask for one number: the acceptance rate. Both universities publish enough to give a better answer, course by course, and to show where in the process applicants are lost. The figures below come from Cambridge's admissions statistics for the 2025 cycle and from Oxford's course pages, which give three-year averages for 2023 to 2025.
Cambridge, 2025 cycle
| Course | Applications | Offers | Acceptances | Accepted |
|---|---|---|---|---|
| Computer Science | 1,739 | 163 | 128 | 7.4% |
| Economics | 1,647 | 195 | 164 | 10.0% |
| Engineering | 3,263 | 392 | 335 | 10.3% |
| Mathematics | 2,032 | 555 | 258 | 12.7% |
| Chemical Engineering and Biotechnology | 541 | 92 | 77 | 14.2% |
| Natural Sciences | 2,644 | 672 | 576 | 21.8% |
| All courses | 22,513 | 4,893 | 3,669 | 16.3% |
Source: University of Cambridge undergraduate admissions statistics, 2025 cycle, table 1.1.
Why maths looks easier than it is
Maths is the odd row. Cambridge made 555 offers and only 258 students took up a place. Almost every maths offer is conditional on STEP, the university's own exam sat in June: grade 1 in STEP 2 and STEP 3 alongside A*A*A at A level. Many offer-holders miss the STEP grade. So the hard part of Cambridge maths comes after the offer, in a three-hour paper that most sixth-form students have never seen anything like. Preparing for STEP from the autumn of year 13 is the single most useful thing a Cambridge maths applicant can do.
Why computer science is the hardest
Computer science had the lowest rate of any large course: 128 places for 1,739 applicants. The offer is A*A*A, but 87% of the students who arrived had A*A*A* or better. The grades in the offer are a floor; the competition happens well above it, in the TMUA and the interview.
Oxford, 2025–26 cycle
Oxford's maths and computer science departments publish their own feedback each January, a year ahead of the university-wide report. These are the applicants of October 2025, for entry in 2026.
| Course | Applications | Shortlisted | Offers | Offer rate |
|---|---|---|---|---|
| Mathematics, and Mathematics and Statistics | 2,052 | 589 | 208 | 10.1% |
| Mathematics and Computer Science | 564 | 206 | 90 | 16.0% |
| Computer Science | 531 | 144 | 58 | 10.9% |
| Computer Science and Philosophy | 118 | 46 | 15 | 12.7% |
| Mathematics and Philosophy | 169 | 56 | 17 | 10.1% |
Sources: Department of Mathematics, admissions feedback 2025; Department of Computer Science, admissions feedback 2025–26. The computer science department counts a joint-course applicant who is offered single honours under the joint course.
Two details in the departments' reports matter more than the rates. The first is the test. The average MAT score was 49.6 among all maths applicants, 66.7 among those shortlisted and 74.0 among those given offers, each three to five marks lower than the year before. The MAT has now been retired, so the scale will not carry over, but the shape will: the shortlist is cut on the test.
The second is where applicants come from. In the computer science family of courses, applicants from outside the UK and EU received offers on 15.3% of applications (72 from 471), against 12.8% for UK applicants and 7.7% for EU applicants. Applying from abroad is not a disadvantage at Oxford in these subjects; a weak test score is.
Oxford, three-year average 2023–25
| Course | Interviewed | Successful | Places a year | Typical offer |
|---|---|---|---|---|
| Mathematics | 32% | 9% | 183 | A*A*A, A*s in Maths and Further Maths |
| Computer Science | 21% | 7% | 55 | A*AA, including A*A in Maths and Further Maths |
| Physics | 31% | 11% | 173 | A*AA |
| Engineering Science | 37% | 15% | 174 | A*A*A |
Source: the course pages on ox.ac.uk. IB offers: 39 points with 766 at Higher Level for maths, computer science and physics; 40 with 776 for engineering.
At Oxford the decisive cut is the shortlist. Over 2023–25, four in five computer science applicants were not interviewed (in the 2025–26 cycle, nearer three in four), and the shortlist is drawn mainly from the admissions test and the predicted grades. For 2027 entry that test is the TMUA for maths and computer science and the ESAT for physics and engineering. Oxford has stopped using its own MAT.
What the numbers mean for an applicant
- The admissions test decides more than the personal statement. At both universities the test is the first filter for maths and computer science, and it is the part of the application a strong student can improve most in six months.
- A higher offer rate is not an easier course. Cambridge maths shows why: the offer is generous and the condition is not.
- Grades are necessary, not sufficient. Almost everyone admitted to these courses has the top grades; they separate nobody.
- Apply where the course suits the student, not where the rate is highest. Interviews test how a student thinks about mathematics they have not seen, and that is very hard to fake.
Questions families ask
What is Oxford's offer rate for maths?
In the 2025–26 cycle Oxford made 208 offers to 2,052 applicants for Mathematics and Mathematics and Statistics, 10.1%. Over 2023–25 the university's own figure for successful applicants averaged 9%.
What is the Oxford computer science acceptance rate?
58 offers from 531 applications in 2025–26, 10.9%, with 144 shortlisted for interview. Oxford's three-year average for successful applicants is 7%, about 55 places a year.
What is the Cambridge computer science acceptance rate?
7.4% in the 2025 cycle: 128 acceptances from 1,739 applications, the lowest of any large Cambridge course.
Which admissions test do Oxford maths and computer science use now?
The TMUA, from the 2026 admissions round (entry in 2027). The MAT ran from 2007 to 2025. Physics and engineering use the ESAT.
What MAT score did successful Oxford applicants have?
In the final MAT year, 2025, successful maths applicants averaged 74.0, shortlisted applicants 66.7 and all applicants 49.6.
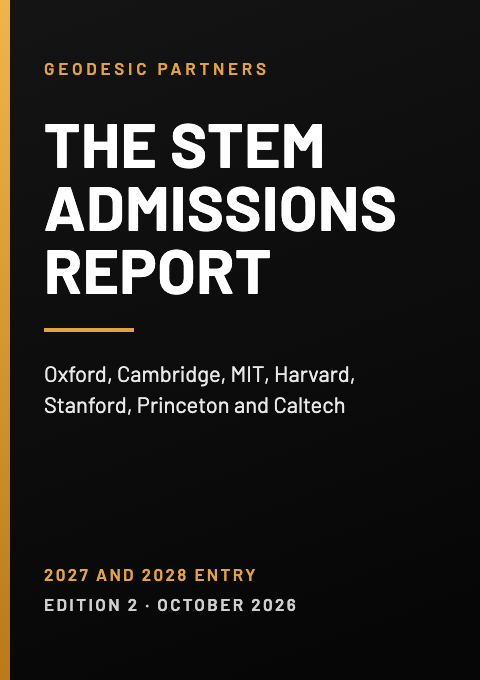
PDF · Edition 2 · £79
The STEM Admissions Report
Oxford, Cambridge, MIT, Harvard, Stanford, Princeton and Caltech: the tests, the grades, the odds by course, the deadlines, and what the degrees lead to.
Related
MIT acceptance rate for international students
MIT took 2.0% of international applicants for the Class of 2029, against 5.4% of US applicants.
MIT figures → ·TMUA practice questions
Questions at TMUA level with worked solutions, for Oxford and Cambridge maths and computer science.
TMUA practice → ·STEP preparation
Cambridge's STEP papers 2 and 3, and the offer condition that catches people out.
STEP preparation → ·Reading a question the way an examiner does
What Oxford's questions are built to detect, and how the December interview differs.
Read the article →